Understandable infographics with exciting topics and themes are readily shared. And when provided with a unique logo, such graphics quickly become brand ambassadors. Today we'll introduce you to 3 of our favorite tools that'll help you create impressive infographics on your own.
Informational infographics are a great way to bring across knowledge smartly. An infographic gets across the benefits of some given information at first glance instead of endless explanations. The result: You're not losing customers' attention with boring words, but keep them engaged. That's why they do well in articles and presentations discussing complex topics. For example, a heating engineer may use an infographic to demonstrate when investment costs for a new heating system pay off. In comparison, a news site may use informational infographics to compare and contrast CO2 emissions of various means of transport on one's way to work. And a corporate blog may instead present the benefits of its product using a process infographic. An infographic conveys the benefits of some given information at first glance instead of endless explanations and the risk of possibly losing customers' attention.
So you can see that whether in a blog, newspaper article, or presentation: Infographics are a way to go! They loosen up environments with much technical jargon, increase retention on a page, and complex information quickly and effectively. You know you're doing it right when your infographic explains a by nature opaque subject and still triggers an "aha effect" in people. The rule of thumb here is that the more understandable an otherwise complex topic is, the greater the "aha effect" experienced. To see what we mean, check out this Basics Image Rights infographic.
A nice bonus of well-made informational images is that they quickly circulate between friends, colleagues, fellow students, and other interested parties. They virtually distribute themselves once they've landed in the proper channels. Therefore, using informational graphics in social media channels, e.g., Facebook or Twitter, generates much attention with only little to no financial effort. The rule of thumb here is very similar to the one before. The more significant the aha effect experienced, the more likely someone will share the infographic with their network and followers. And just one last reminder: Don't forget to place your logo or brand on your infographics when implementing this strategy!
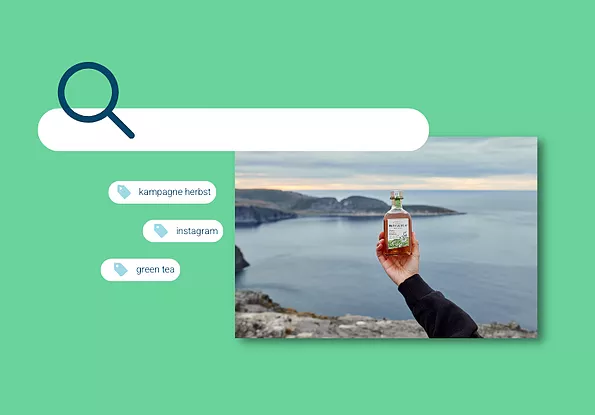
When it comes to infographics, image management systems such as pixx.io help tremendously - graphics become available to all employees, can be integrated directly from WordPress, Typo3, and Co., or shared on Facebook and Twitter thanks to the connection to CMS.
There are several (free) online tools with which you can create infographics on your own. And here we present to you 3 of our personal favorites, so knuckle down.
Canva
Canva's drag and drop editor is free and comes with various free objects such as illustrations, photos, and designs. You're able to personalize and change any of the provided templates according to your wishes. But heads up! A note may pop up during download to let you know that a license is required for the template you've chosen. Why? Well, because some of Canva's templates contain objects that need a permit for you to export them without a watermark.
The elements available for free make creating very fancy informational graphics possible. Yet, if you'd like to individualize your materials even more and want an extensive selection of options, then you should consider Canva's pro plan. It costs around 130,00 US Dollars (approx. 109,99 Euros) per year and is for up to five people.
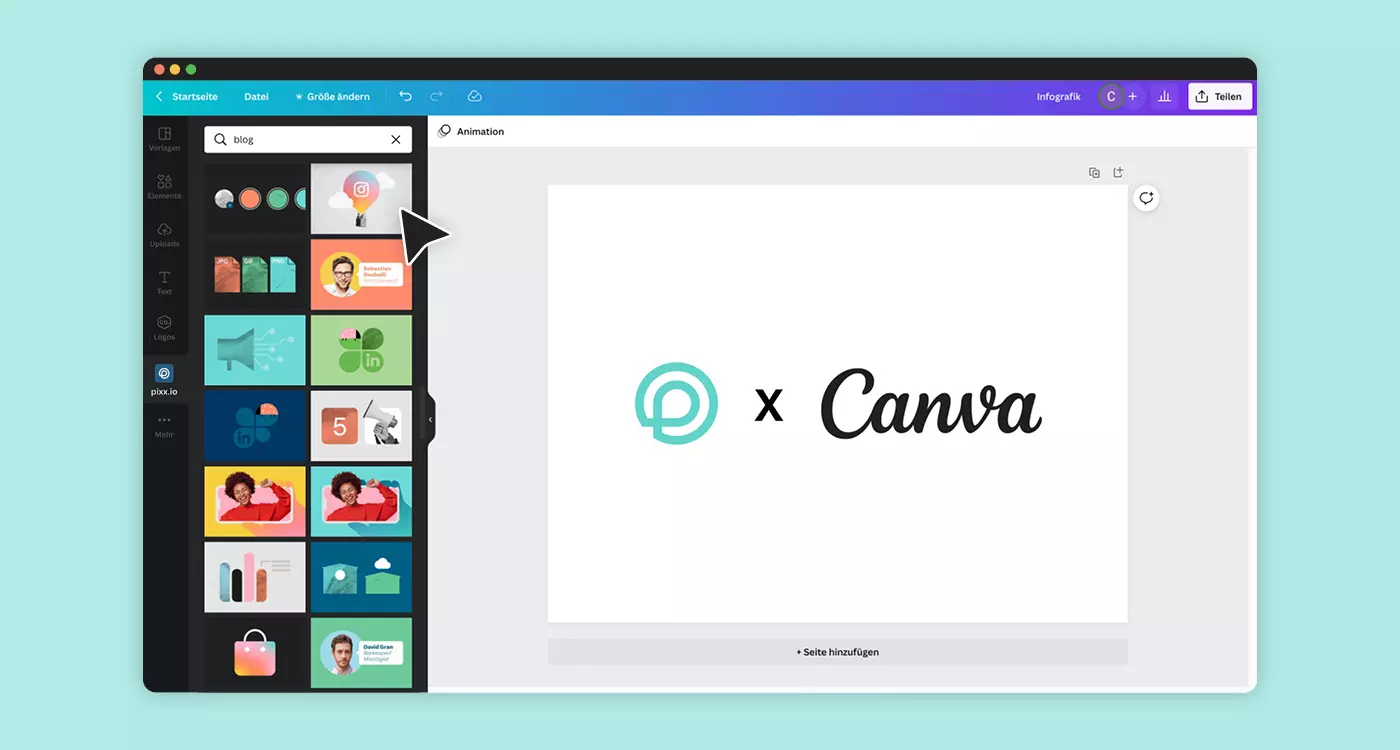 In Canva you can use images directly from your pixx.io cloud
Piktochart
Piktochart's basic version is free. The cool thing is that even after registering for the basic plan, many features are still available in the info image editor, reminiscent of modern image editing programs in terms of design. You can edit icons, lines, photos, backgrounds, and more. Plus, Piktochart even provides you with some templates to give free rein to your creativity. It’s amazing that all of that is in their free version!
Additionally, Piktochart allows you to create several related infographics ("blocks"), which you can either export as one long graphic or individually.
Hold your horses because Piktochart's Pro version unlocks over 600 templates and allows the export of PNG images (and PDFs) in the best quality. Besides, the watermarks that you'll see attached to the bottom of a graphic in the free version disappear once you upgrade to a Pro account. A Pro account costs 24 US Dollars (approx. 20 Euros) per month per user if you decide to go with the monthly payment option. On the other hand, annual payment costs you 14 US Dollars (approx. 12 Euros) per month, per user. Which comes in at about 168 US dollars (approx. 142 Euros) per year, per user.
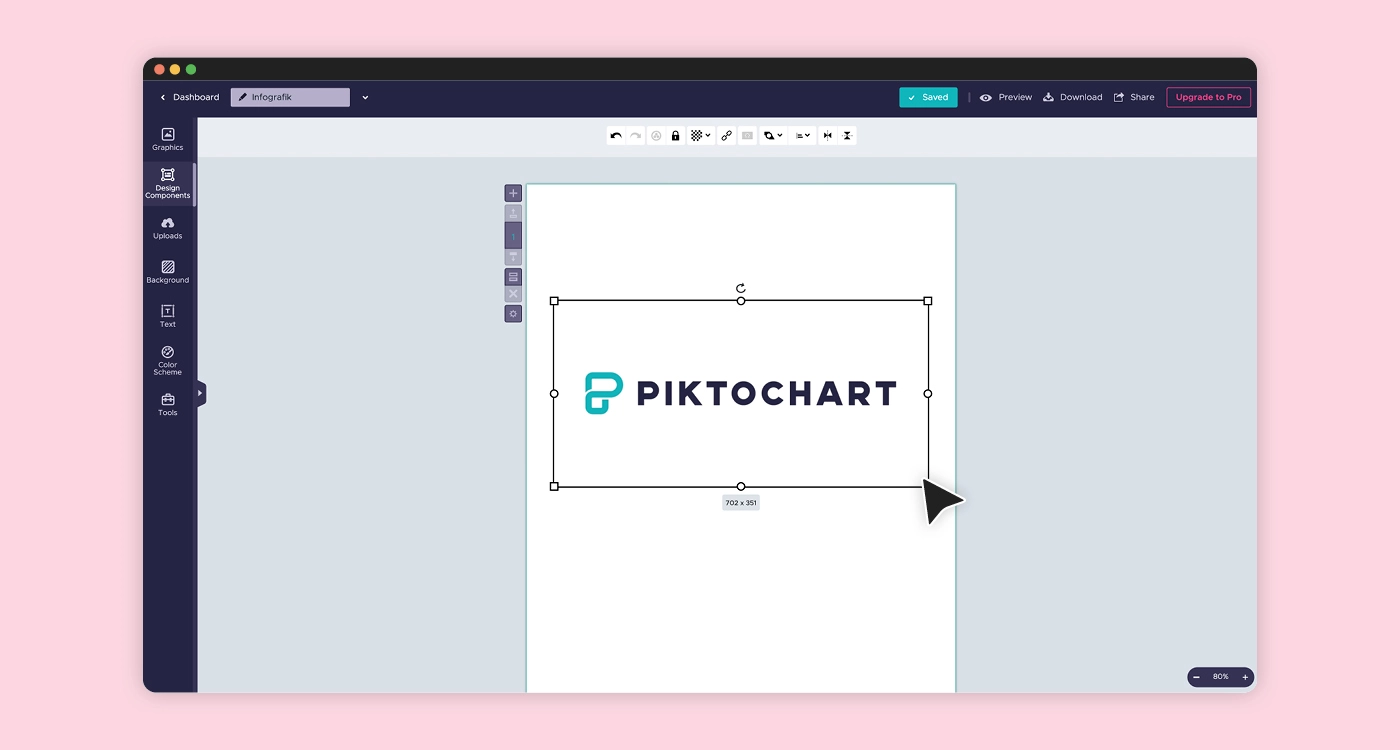 Piktochart helps you to create exciting infographics
Easel.ly
After the free registration, you'll get all the creative features of Easel.ly's web editor, which entails numerous “pre-provided” templates. Alternatively, there's also the option to make templates uniquely yours. The choice to freely place shapes and connections, as well as text on your graphics, for example, is totally up to you. You can also format them according to your wishes and even integrate and design a few diagram types yourself.
With Easel.ly's free version, you'll be able to create exciting infographics. And with self-uploaded graphics, you'll even stand out visually from the crowd of designers.
However, when exporting any infographic, you'll encounter one drawback: the download is only possible as a low-quality JPEG. Although the size and image quality should be sufficient for most online purposes, they are hardly suitable for printable graphics or PDF use. Therefore, if you want to download it in high quality or as a PDF, you must switch to a business account. The upgrade will cost you about 60 US dollars (approx. 51 euros) per year, but that unlocks more icons, stock photos, templates, and design options.
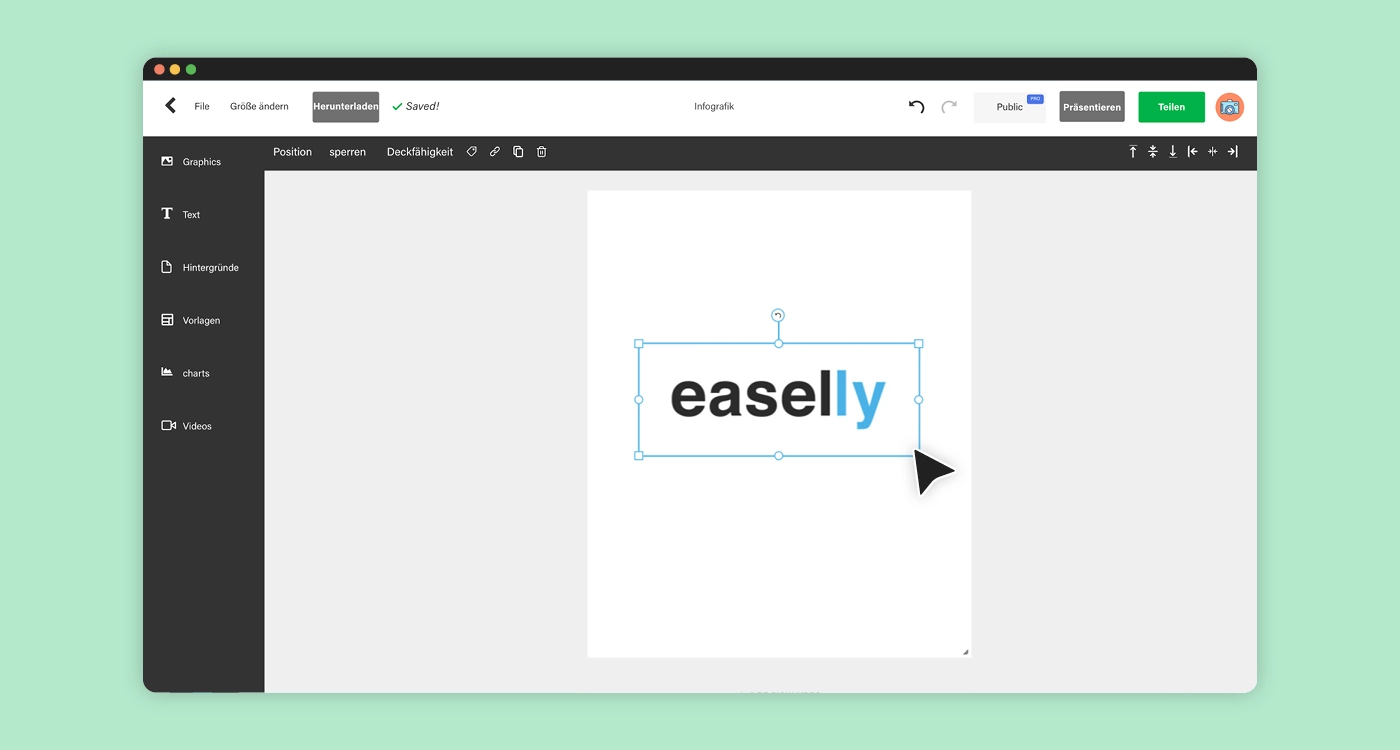 Create infographics with the free easel.ly account
Time to get started!
Be ready to create stunning infographics that will impress your followers. It's possible with any of the 3 tools we've introduced to you above. You'll see that even when using free versions, you'll be able to achieve excellent results. All you need now is a suitable theme, and off you go.
PS: Have you heard of pixx.io yet? pixx.io is stress-free image management that allows you to keep your entire media pool in check. With pixx.io, users efficiently organize their media files, access their media pool much faster, and share targeted content. The media pool can be integrated directly into Photoshop, InDesign, and Co through apps and plugins in the CMS or Office applications. Find out more about pixx.io now and test it for free!